For our final tech play assignment, I have chosen to explore some physics content objects. To do this, I wanted to make sure that I sought out things that I had no experience with that I could use this time to dive into and to think about how I could incorporate them into my existing physics, chemistry, and statistics classes. I have outlined each of the content objects below and, in the end, I’ll propose a couple of sample lessons.
oPhysics
oPhysics is a series of interactive physics simulations that were created using GeoGebra by, retired physics teacher, Tom Walsh. When I first looked into this site, I thought it was just going to be a collection of animations. The animations were very well done and do allow for some input from the student that could allow for exploration, but, at that point, I didn’t really see it as being particularly useful. However, after I kept exploring, I found that there are lab simulations that students can interact with and, even more helpful, drawing tools. The drawing tools include a mechanics drawing set that lets students create standard images that you would see in the earlier units in physics, a graphing tool, and, most importantly, a circuit diagram drawing tool–drawing circuits has long been a struggle unlike any others for physics teachers and students, I tend to just write problems that go along with diagrams I can find online.
The main function of oPhysics could be anything from simply finding simulations for students to interact with to using the creative tools for lab reports and problem-solving assignments. There really is a ton that you and your students can do.
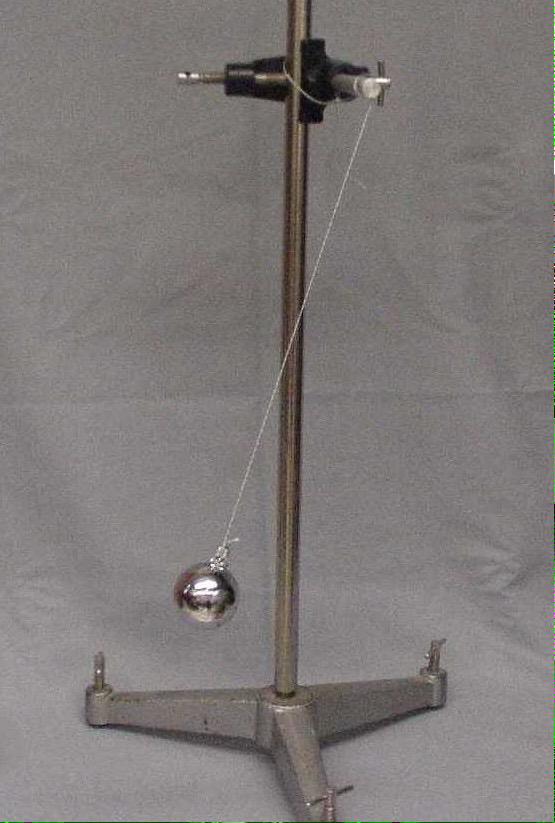
The one thing that I wish is for there to be more “Quiz” assignments. In the Conservation menu, there is a great simulation that calls for students to measure some things in a ballistic pendulum and then to predict the launch velocity of the projectile. The simulation gives them instant feedback as to whether or not their answer is correct. These would be great on a sub day, because they are so easy to grade; all that students would have to do is to take a screenshot of their final results. The initial parameters are also random so students won’t get the same answers as each other and, therefore, could help each other without cheating.
Desmos Activity Builder
I have been using Desmos since it launched back in 2011. Through the years, I have made extensive use of their graphing calculator and absolutely love its simplicity and expansive capabilities. However, I have never really spent much time on their Activity Builder. The Activity Builder is very similar to a test administering software, except, since it’s housed in a graphing calculator, it has a lot more functionality. I really started to appreciate it more when I started to look through some of my favorite teachers’ public activity libraries. Desmos allows you to publish all of your activities through their platform, meaning that there is most likely already a simulation out there for any concept or topic that you would want to explore.
I suppose the main purpose of activity builder would be for assessment purposes, but not necessarily summative assessment. Some of the items that these teachers shared were great formative assessments. For example, one teacher shared a digital card sort asking students to categorize x-t, v-t, and a-t graphs. This would be a great quick and easy way to get data on a particular student.
I don’t have a ton of complaints about the Activity Builder. I guess the only one I can actually think of is the lack of instructions for teachers who are new to the software. Even after going through a lot of simulations, I was sort of at a loss at how to go about creating my own activities. I’m sure there is a ton of YouTube videos out there, but I was looking for something that was embedded to walk me through and I couldn’t find it.
Phyphox / Physics Toolbox
These are two app suites for Android and iOS that utilize all of your phone’s sensors to collect data that can be used to analyze physics phenomena. Phyphox seems to be a bit more robust, including a few more applications than Physics Toolbox, but Physics Toolbox seems to be more widespread with more teachers utilizing its capabilities. Some of the modes of sensor data that can be collected include Accelerometer, Gyroscope, Magnetometer, Pressure, and Audio. They also have some very clever things that you can do with these data such as an audio stopwatch and a speedometer that uses magnets.
The main purpose of these two suites of apps is for data collection. Measurement tools are the single most important aspect of any lab. You can have the most expensive equipment but if you don’t have an accurate and reliable source of measurement your labs are useless.
One thing that I don’t love about it is that the data is a bit choppy. I’m not sure if there is any data smoothing written into the program. As is, the data is very choppy making it harder for students to ascertain the correct relationships.
R-Studio
R is a programming language designed specifically for the statistical analysis of large data sets. I originally thought that this was unnecessary and only served as an alternative to Excel and Sheets, but it does so much more. With one line of code, you are able to remove all instants of a certain value from your data set, do a t-test, χ2, regression analysis, etc. All of these capabilities make analyzing very large data sets much more manageable than if they were done in one of the other platforms. R is also better at creating visuals from data sets than Excel and Sheets.
The one complaint I have about R is similar to the one that I have for Desmos Activity Builder and that is the high learning curve. The vast majority of things that will need to be done in an AP Statistics course are capable of being done in Excel/Sheets–or a TI-calculator. However, teaching students about R, probably the second-most popular programming language, could be an excellent project for the time after the AP exam.
Sample Lesson 1: Kinematics Investigation
Overview:
This is a lesson that I devised to introduce kinematic graphs to students. It comes after some initial work that introduces and differentiates the concepts of distance/displacement, speed/velocity, and acceleration. Once students have a firm grasp of what each of these terms means, they need to learn how to identify them from different forms of representations.
In my conception of this lesson, I’d start by having the students play around with this oPhysics simulation that allows students to vary the acceleration, starting position, and initial velocity of an object and then see how this affects the graph. To help them make the necessary connections, I’d probably provide them with a few guiding questions: such as, “how do you make the graph curve upwards?”, “how can you make the graph have a negative slope?”, “what do you have to do to make the graph flat?”. These questions should help them see how each of the three variables mentioned above is represented on a kinematic graph.
After that, they move on to a learning progression created by Frank Noschese on Desmos Activity Builder. The learning progression starts with a card sort then moves on to a set of “select all that apply” questions, before finishing with another card sort with more complicated graphs to analyze.
Content:
- AP Physics 1: CHA.1.2 Representations of Motion
- Mississippi College and Career Readiness Standards: PHY.1.2 Interpret and predict 1-D motion based on displacement vs. time, velocity vs. time, or acceleration vs. time graphs.
Pedagogy:
This lesson is based on Kolb’s Experiential Learning Theory. By having students first experience the topics, they are more receptive to instruction later. Also, by moving from concrete experiences to abstract reasoning, students are better able to grasp the concepts.
Technology:
The oPhysics Simulation’s affordances make this lesson possible by allowing students to alter various parameters in a closed and simple fashion and then see the corresponding motion and graph simultaneously. This wouldn’t be possible without oPhysics–or a similar software package–because in the real world you have to resort to some hand waving in order to alter all of these variables. It’s possible, but not nearly as easy.
The Activity Builder Learning Progression finishes this lesson nicely because it allows for students to answer in alternative formats to the traditional assessment types. The learning progression could even be modified to include questions that require students to use a trackpad or mouse to draw specific motion graphs.
Alternative Formats:
Of course, a similar lesson could be done without using these technologies. Prior to 2021, I worked at a school with only four laptop carts for a school of 1400 students and we got by. However, the inclusions of these technologies Enhance–SAMR model–the lesson by increasing the functionality. If I didn’t have these technologies, I’d probably introduce the graphs with an activity that has students graph the motion of constant velocity buggies by hand. The downside of this lesson is it takes a TON of time for the students to make the simple graphs created by oPhysics in a couple of seconds and it doesn’t illustrate accelerated motion. To do that, you’d need a dynamics cart, a variably inclined plane, and a motion sensor. All of that equipment can get expensive and makes set up a nightmare.
Sample Lesson 2: AP* Statistics Research Project / COVID Project
This lesson would, ideally, bookend a year of introductory statistics. The task would be simple, to use data to make informed decisions. This could be left open, but I think, in light of our current situation, it might be better to use any of the legions of publicly available COVID statistics to validate/invalidate commonly-held notions concerning the pandemic***. These could range from “do vaccines really help prevent individuals from contracting COVID?” to “are you more likely to die from COVID if you are older?”. The topics are sensitive due to the political climate in our country, but I believe that showing students how to form opinions based on data is one of the most important skills that we can teach our students. After the initial project is given, students could be put into groups and given a couple of weeks to research and create a presentation that they would give to their peers or some wider audience.
*** Some might say that leaving the project more open is always preferable, but, in my experience, students tend to struggle choosing topics. Identifying potential topics for research is a valuable skill to have, so maybe a good compromise would be to present students with a number of appropriate data sets and to have them select one and formulate a question that they could answer from that set.
Content:
AP Statistics – This project would cover all of the Course Skills that pervade the curriculum. These skills are 1: Selecting Statistical Methods, 2: Data Analysis, 3: Using Probability and Simulation, and 4: Statistical Argumentation. Of course, the project also hits many individual content standards, but which ones are included would depend on the focus questions that the students formulate.
Pedagogy:
This lesson would serve as a performance task, something not credited with any one person but, rather, as a name for something that good pedagogy has consisted of for many years. Any good assessment system should consist of multiple measurements from various assessment types.
Technology:
As previously mentioned, R allows students to maintain and analyze very large sets of data. Without R, or a similar software package, an analysis like this wouldn’t be possible. It’s also important to use software packages like this, because of their popularity in the workforce and in academia. If a student is introduced to them earlier and allowed a safe environment in which to explore, they are going to pick up on them faster making them more valuable to future employers.
Alternative Formats:
As mentioned earlier, most of this analysis could be done in Excel or Sheets, but as the data sets become larger and larger and the visuals become more complex, those two platforms become inferior. With data sets that include the entire country, like the COVID data from the CDC, Johns-Hopkins, or the Mayo Clinic do, the need for R arises. If a teacher was unfamiliar with R or just didn’t want to take the time to teach an entire programming language, a simple random sample could be taken from the parent sample. If the sample were small enough, then a similar analysis could be conducted in Excel/Sheets. In any event, this work, using any of these three platforms, transforms–SAMR model–a lesson about hypothesis testing and statistical tools.